Note
Click here to download the full example code
Plotting stability scores
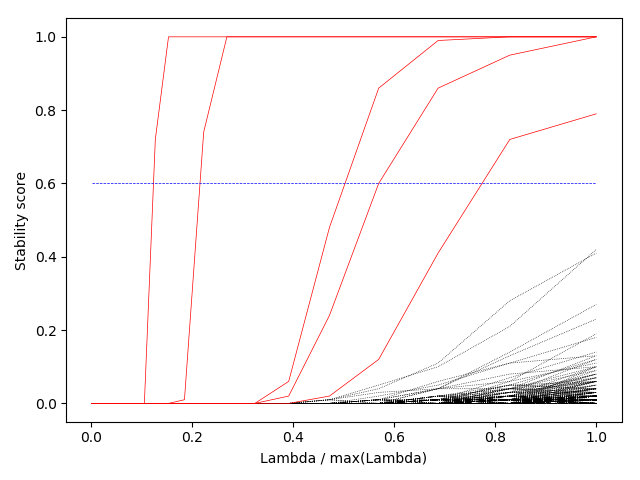
An example plot of the stability scores for each variable after fitting stability_selection.stability_selection.StabilitySelection

Out:
Selected variables are:
-----------------------
Variable 1: [180], score 0.790
Variable 2: [495], score 1.000
Variable 3: [523], score 1.000
Variable 4: [524], score 1.000
Variable 5: [647], score 1.000
import numpy as np

from sklearn.linear_model import LogisticRegression
from sklearn.pipeline import Pipeline
from sklearn.preprocessing import StandardScaler
from sklearn.utils import check_random_state
from stability_selection import StabilitySelection, plot_stability_path


def _generate_dummy_classification_data(p=1000, n=1000, k=5, random_state=123321):

    rng = check_random_state(random_state)

    X = rng.normal(loc=0.0, scale=1.0, size=(n, p))
    betas = np.zeros(p)
    important_betas = np.sort(rng.choice(a=np.arange(p), size=k))
    betas[important_betas] = rng.uniform(size=k)

    probs = 1 / (1 + np.exp(-1 * np.matmul(X, betas)))
    y = (probs > 0.5).astype(int)

    return X, y, important_betas


if __name__ == '__main__':
    n, p, k = 500, 1000, 5

    X, y, important_betas = _generate_dummy_classification_data(n=n, k=k)

    base_estimator = Pipeline([
        ('scaler', StandardScaler()),
        ('model', LogisticRegression(penalty='l1'))
    ])
    selector = StabilitySelection(base_estimator=base_estimator, lambda_name='model__C',
                                  lambda_grid=np.logspace(-5, -1, 50))
    selector.fit(X, y)

    fig, ax = plot_stability_path(selector)
    fig.show()

    selected_variables = selector.get_support(indices=True)
    selected_scores = selector.stability_scores_.max(axis=1)

    print('Selected variables are:')
    print('-----------------------')

    for idx, (variable, score) in enumerate(zip(selected_variables, selected_scores[selected_variables])):
        print('Variable %d: [%d], score %.3f' % (idx + 1, variable, score))
Total running time of the script: ( 1 minutes 24.598 seconds)